RAUP 'S REAL EXTINCTION DATA FROM THE PHANEROZOIC
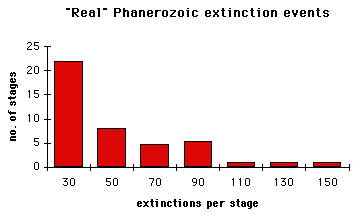
He divided the Phanerozoic into 77 periods of about 7 million years each.
For each interval, data was assembled for the number of families that went
extinct. What he found were many small extinctions and few large ones .


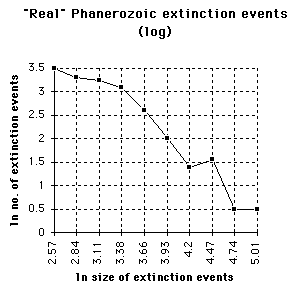
As can be seen , it is not quite a power law distribution (i.e. a straight
line of negative slope),
but it is very close. 77 data points is probably too few and thus not extremely
accurate. Therefore, a strong clue ,but not proof, exists in the rock record
to represent self-organized criticality
and thus complex behaviour in biological evolutionary processes.
Complexity studies at Carleton University
Complexity index


